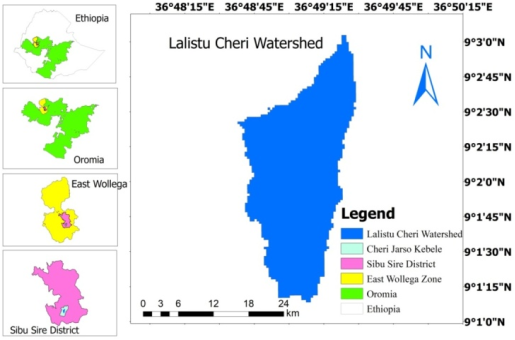
Soil acidity, a significant form of chemical soil degradation, is one of the most pressing challenges in Ethiopia, particularly in the highlands. It severely impacts agricultural productivity across much of the country. Owing to its impact on crop production and productivity, it is a critical issue that requires immediate attention in most highlands in Ethiopia. This study was conducted at the Lalistu Cheri watershed, which is located in the Sibu Sire District of the western zone of the Oromia region, Ethiopia, with the objective of characterizing and assessing the soil acidity status under different land use types and soil depths. Replicated composite soil samples were collected from three representative land use types (cultivated, grazing, and eucalyptus plantation lands) and two soil depths (0-20 and 20-40 cm) by X-patterns along transects and analyzed via standard laboratory procedures. The results revealed spatial variation in the soil properties among the land use types and soil depths. The soils in both cultivated and eucalyptus plantation land were strongly acidic (pH<5.5), whereas those in grazing land were moderately acidic. The highest (54.89%) and lowest (43.73%) clay contents were recorded in the soils of cultivated and grazed lands, respectively, whereas the sand content was greater (36.11%) in the eucalyptus plantation land. The relatively highest bulk density (1.36 g cm-3) was recorded in the grazed land soils, followed by the cultivated land soils (1.32 g cm-3). Both the exchangeable acidity and aluminum content in all land use types decreased with increasing soil depth, which was consistent with their acid saturations. The organic carbon content ranged from 2.30% at the subsurface layer of the cultivated land to 3.44% at the surface layer of the grazing land soils, whereas the total nitrogen content ranged from 0.19% to 0.30%. Available P ranged from 7.31 mg kg-1 to 12.61 mg kg-1. The highest Ca, Mg, Na, and K contents (8.92, 5.76, 0.30, and 1.26 Cmol (+) kg-1, respectively) were recorded in the soils of the grazing land. The amount of PBS used ranged from 35.14% to 78.45%. The CEC and ECEC of the soils in the three land use types also increased consistently with increasing soil depth. Micronutrient concentrations decreased with soil depth. The Fe and Mn contents ranged from 0.54 and 4.42 mg kg-1 in the subsurface layer of the grazing land and eucalyptus plantations, respectively, to 10.58 and 12.14 mg kg-1 in the surface layer of the eucalyptus plantations and grazing land soils, respectively. Cu and Zn also ranged from 1.52 and 0.29 mg kg-1 to 3.16 and 0.85 mg kg-1, respectively. The study suggests that both CL and EPL soils exhibit the highest acidity and require soil management practices, such as lime application, to reduce acidity and improve soil fertility. On the other hand, GL soils show more favorable conditions for nutrient retention and pH.
| Published in | American Journal of Chemical and Biochemical Engineering (Volume 9, Issue 1) |
| DOI | 10.11648/j.ajcbe.20250901.12 |
| Page(s) | 18-37 |
| Creative Commons |
This is an Open Access article, distributed under the terms of the Creative Commons Attribution 4.0 International License (http://creativecommons.org/licenses/by/4.0/), which permits unrestricted use, distribution and reproduction in any medium or format, provided the original work is properly cited. |
| Copyright |
Copyright © The Author(s), 2025. Published by Science Publishing Group |
Depth, Land Use Types, Soil Acidity, Surface, Subsurface
LandUse | CultivatedLand | EucalyptusPlantationland | GrazingLand | |||||||
|---|---|---|---|---|---|---|---|---|---|---|
Parameters | SD (cm) | Range | Mean (±SEM) | SDV | Range | Mean (±SEM) | SDV. | Range | Mean (±SEM) | SDV. |
Sand% | 0-20 | 27-41 | 31.56±1.64 | 4.93 | 27-43 | 36.11±1.96 | 5.93 | 31-43 | 35.67±1.49 | 4.47 |
20-40 | 17-29 | 24.33±1.25 | 3.74 | 25-37 | 31.67±1.25 | 3.74 | 29-37 | 32.33±1.00 | 3.00 | |
Silt% | 0-20 | 19-23 | 21.77±0.46 | 1.39 | 15-25 | 20.11±1.06 | 3.18 | 15-23 | 20.55±0.87 | 2.60 |
20-40 | 19-23 | 20.78±0.52 | 1.56 | 15-21 | 16.56±0.80 | 2.40 | 15-21 | 18.11±0.59 | 1.76 | |
Clay% | 0-20 | 38-52 | 46.67±1.70 | 5.10 | 34-54 | 43.78±2.61 | 7.84 | 38-54 | 43.78±2.01 | 6.04 |
20-40 | 52-60 | 54.89±0.89 | 2.67 | 48-58 | 51.77±1.18 | 3.53 | 44-54 | 49.56±1.19 | 3.57 | |
STC | 0-20 | Clay | Clay | Clay | ||||||
20-40 | Clay | Clay | Clay | |||||||
BDgml-3 | 0-20 | 1.19-1.29 | 1.26±0.01 | 0.03 | 1.09-1.19 | 1.15±0.01 | 0.03 | 1.26-1.32 | 1.29±0.01 | 0.02 |
20-40 | 1.25-1.39 | 1.32±0.01 | 0.04 | 1.15-1.29 | 1.24±0.02 | 0.06 | 1.25-1.40 | 1.36±0.01 | 0.03 | |
Tp% | 0-20 | 51.32-55.09 | 52.58±0.42 | 1.25 | 55.09-58.87 | 56.65±0.37 | 1.11 | 50.09-52.45 | 51.15±0.30 | 0.89 |
20-40 | 47.55-52.83 | 50.10±0.56 | 1.68 | 51.32-56.6 | 53.25±0.73 | 2.19 | 47.17-50.57 | 48.68±0.32 | 0.96 | |
Landuse | CultivatedLand | EucalyptusPlantationLand | Grazingland | |||||||
|---|---|---|---|---|---|---|---|---|---|---|
Parameters | S.D (cm) | Range | Mean±SEM | SDV | Range | Mean±SEM | SDV | Range | Mean±SEM | SDV |
pH(H2O) | 0-20 | 4.96-5.36 | 5.14±0.05 | 0.14 | 4.98-5.43 | 5.27±0.04 | 0.13 | 5.39-5.74 | 5.58±0.04 | 0.12 |
20-40 | 5.14-5.61 | 5.47±0.05 | 0.14 | 5.19-5.59 | 5.48±0.04 | 0.13 | 5.54-5.91 | 5.74±0.05 | 0.14 | |
Ex.Acidity | 0-20 | 2.43-3.47 | 3.04±0.12 | 0.36 | 3.51-5.39 | 4.14±0.19 | 0.58 | 0.43-1.52 | 0.95±0.14 | 0.42 |
20-40 | 1.09-3.18 | 2.25±0.23 | 0.68 | 1.83-3.58 | 2.73±0.20 | 0.60 | 0.32-1.21 | 0.70±0.12 | 0.35 | |
Ex.Al | 0-20 | 0.69-3.24 | 1.93±0.28 | 0.83 | 2.63-5.22 | 3.64±0.28 | 0.83 | 0.14-1.16 | 0.69±0.13 | 0.38 |
20-40 | 0.81-2.78 | 1.76±0.25 | 0.74 | 1.62-3.41 | 2.23±0.20 | 0.61 | 0.08-0.96 | 0.49±0.11 | 0.34 | |
PAS% | 0-20 | 19.27-48.46 | 32.39±2.97 | 8.94 | 24.31-49.89 | 41.46±2.62 | 7.87 | 2.98-11.64 | 6.26±0.97 | 2.92 |
20-40 | 10.28-27.18 | 18.98±1.98 | 5.93 | 13.64-26.08 | 20.49±1.54 | 4.61 | 2.13-7.33 | 4.10±0.66 | 1.97 | |
Landuse | CultivatedLand | EucalyptusPlantationLand | Grazingland | |||||||
|---|---|---|---|---|---|---|---|---|---|---|
Parameters (cmol(+)kg-1) | S.D (cm) | Range | Mean±SEM | SDV | Range | Mean±SEM | SDV | Range | Mean±SEM | SDV |
SOC (%) | 0-20 | 2.24-3.06 | 2.66±0.10 | 0.29 | 2.50-3.53 | 3.00±0.12 | 0.37 | 3.05-3.9 | 3.44±0.08 | 0.25 |
20-40 | 2.02-2.68 | 2.30±0.07 | 0.22 | 2.20-2.85 | 2.45±0.08 | 0.23 | 2.59-3.32 | 2.85±0.08 | 0.23 | |
TN (%) | 0-20 | 0.21-0.28 | 0.25±0.009 | 0.03 | 0.24-0.32 | 0.28±0.010 | 0.03 | 0.26-0.34 | 0.30±0.008 | 0.02 |
20-40 | 0.16-0.22 | 0.19±0.007 | 0.02 | 0.18-0.24 | 0.20±0.007 | 0.02 | 0.22-0.29 | 0.25±0.007 | 0.02 | |
C:Nratio | 0-20 | 10.39-10.93 | 10.67±0.05 | 0.14 | 10.42-11.03 | 10.77±0.07 | 0.21 | 11.47-11.79 | 11.63±0.03 | 0.10 |
20-40 | 11.9-13.31 | 12.42±0.14 | 0.42 | 11.88-12.28 | 12.14±0.05 | 0.15 | 11.38-11.77 | 11.55±0.05 | 0.14 | |
AP(ppm) | 0-20 | 7.48-13.43 | 8.69±0.62 | 1.87 | 7.42-10.7 | 8.51±0.33 | 0.99 | 7.78-23.4 | 12.61±1.61 | 4.82 |
20-40 | 6.69-8.87 | 7.45±0.23 | 0.69 | 6.02-8.33 | 7.31±0.22 | 0.67 | 7.05-16.23 | 9.12±0.96 | 2.87 | |
Landuse | CultivatedLand | EucalyptusPlantationLand | Grazingland | |||||||
|---|---|---|---|---|---|---|---|---|---|---|
Parameters (cmol(+)kg-1) | S.D(cm) | Range | Mean±SEM | SDV | Range | Mean±SEM | SDV | Range | Mean±SEM | SDV |
Ca | 0-20 | 1.34-6.53 | 3.57±0.55 | 1.64 | 1.31-3.52 | 2.14±0.23 | 0.68 | 6.52-8.76 | 7.85±0.23 | 0.70 |
20-40 | 4.04-7.26 | 5.49±0.36 | 1.07 | 2.52-6.14 | 5.01±0.33 | 1.00 | 8.19-9.71 | 8.92±0.14 | 0.42 | |
Mg | 0-20 | 1.46-3.93 | 2.29±0.29 | 0.86 | 1.62-8.01 | 2.97±0.67 | 2.01 | 3.71-6.55 | 5.05±0.31 | 0.92 |
20-40 | 2.68-4.00 | 3.08±0.16 | 0.49 | 3.01-10.45 | 4.64±0.83 | 2.48 | 4.66-7.21 | 5.76±0.29 | 0.88 | |
Na | 0-20 | 0.04-0.16 | 0.11±0.01 | 0.04 | 0.04-0.16 | 0.11±0.01 | 0.04 | 0.06-0.81 | 0.26±0.07 | 0.22 |
20-40 | 0.11-0.17 | 0.14±0.01 | 0.02 | 0.11-0.17 | 0.11±0.01 | 0.03 | 0.08-0.97 | 0.30±0.09 | 0.27 | |
K | 0-20 | 0.7-1.01 | 0.85±0.03 | 0.09 | 0.82-1.08 | 0.93±0.03 | 0.10 | 0.06-1.21 | 1.17±0.01 | 0.04 |
20-40 | 0.88-1.13 | 0.96±0.03 | 0.08 | 1.88-1.17 | 0.99±0.04 | 0.12 | 1.19-1.36 | 1.26±0.02 | 0.05 | |
CEC | 0-20 | 14.76-18.78 | 15.78±0.42 | 1.25 | 16.11-18.72 | 17.50±0.30 | 0.89 | 17.74-20.04 | 18.87±0.34 | 1.03 |
20-40 | 16.26-19.12 | 17.61±0.37 | 1.12 | 18.08-21.51 | 19.27±0.36 | 1.07 | 18.92-22.76 | 20.70±0.48 | 1.44 | |
ECEC | 0-20 | 7.16-14.17 | 9.87±0.76 | 2.29 | 8.04-15.18 | 10.29±0.74 | 2.22 | 13.06-16.93 | 15.30±0.46 | 1.38 |
20-40 | 10-14.69 | 11.92±0.46 | 1.38 | 11.57-19.58 | 13.47±0.79 | 2.36 | 14.98-18.67 | 16.95±0.44 | 1.33 | |
PBS% | 0-20 | 22.78-76.88 | 43.76±5.62 | 16.87 | 25.52-64.62 | 35.12±4.13 | 12.40 | 62.65-85.45 | 76.15±2.60 | 7.80 |
20-40 | 44.48-73.11 | 55.09±2.99 | 8.98 | 47.33-90.62 | 56.04±4.41 | 13.24 | 69.9-91.22 | 78.84±2.76 | 8.28 | |
Landuse | CultivatedLand | EucalyptusPlantationLand | Grazingland | |||||||
|---|---|---|---|---|---|---|---|---|---|---|
Parameters (mgKg-1) | S.D(cm) | Range | Mean±SEM | SDV | Range | Mean±SEM | SDV | Range | Mean±SEM | SDV |
Fe | 0-20 | 2.74-10.91 | 7.03±2.37 | 4.10 | 7.25-13.91 | 10.58±3.33 | 4.71 | 0.68-7.46 | 4.07±3.39 | 4.79 |
20-40 | 2.03-8.53 | 5.63±1.91 | 3.31 | 2.03-8.53 | 2.72±1.91 | 3.31 | 0.39-0.68 | 0.54±0.15 | 0.21 | |
Mn | 0-20 | 3.24-15.14 | 9.14±3.44 | 5.95 | 8.48-8.82 | 8.65±0.17 | 0.24 | 9.55-14.73 | 12.14±2.59 | 3.66 |
20-40 | 1.03-13.75 | 8.33±3.79 | 6.57 | 2.38-6.71 | 4.42±1.26 | 2.18 | 4.47-14.17 | 9.32±4.85 | 6.86 | |
Cu | 0-20 | 0.51-2.47 | 1.63±0.58 | 1.01 | 2.14-2.89 | 2.52±0.38 | 0.53 | 3-3.31 | 3.16±0.16 | 0.22 |
20-40 | 0.61-2.31 | 1.52±0.49 | 0.86 | 1.86-2.71 | 2.18±0.27 | 0.46 | 0.96-2.69 | 1.83±0.87 | 1.22 | |
Zn | 0-20 | 0.69-3.24 | 0.55±0.008 | 0.09 | 2.63-5.22 | 0.47±0.001 | 0.03 | 0.14-1.16 | 0.85±0.304 | 0.55 |
20-40 | 0.81-2.78 | 0.40±0.016 | 0.13 | 1.62-3.41 | 0.29±0.010 | 0.10 | 0.08-0.96 | 0.60±0.205 | 0.45 | |
AAS | Atomic Absorption Spectrophotometer |
BD | Bulk Density |
CEC | Cation Exchange Capacity |
Cmol (+)/kg | Cent Mole of Cations per Kilogram of Soil |
DTPA | Diethylene Triamine Pentaacetic Acid |
ECEC | Effective Cation Exchange Capacity |
Ethio SIS | Ethiopian Soil Information System |
PD | Particle Density |
PAS | Percentage Acid Saturation |
PBS | Percent Base Saturation |
SOM | Soil Organic Matter |
USDA | United States Department of Agriculture |
WHO | World Health Organization |
| [1] | Fekadu, T. (2018). Soil acidity and its impact on agricultural productivity in Ethiopia. Journal of Soil Science and Environmental Management, 9(3), 105-112. |
| [2] | Sisay Golla, A. (2019). Soil acidity and its management options in Ethiopia: A review. International Journal of Scientific Research and Management, 7(11), 1-9. |
| [3] | Melese, A., & Yli-Halla, M. (2016). Soil acidity and nutrient management in Ethiopia's highlands. Geoderma, 274, 73-80. |
| [4] | Agegnehu, G., Bass, A., & Nelson, R. (2019). Soil acidity and crop productivity: Implications for sustainable agriculture in Ethiopia. Soil Science Society of America Journal, 83(2), 524-533. |
| [5] | EthioSIS (Ethiopian Soil Information System). (2014). Toward improved fertilizer recommendations in Ethiopia-Nutrient indices for categorization of fertilizer blends from EthioSISworeda soil inventory data. Addis Ababa, Ethiopia. |
| [6] | ATA (Agricultural Transformation Agency). (2014). Soil management for sustainable agricultural productivity in Ethiopia. ATA Report, 4(1), 22-34. |
| [7] | Agegnehu, G., Amede, T., Erkossa, T., Yirga, C., Henry, C., Tyler, R., & Sileshi, G. W. (2021). Extent and management of acid soils for sustainable crop production system in the tropical agroecosystems: A review. Acta Agriculturae Scandinavica, Section B—Soil & Plant Science, 71(9), 852-869. |
| [8] | Osundwa, P., Ogbodo, C., & Okon, U. (2013). Soil acidity, nutrient availability, and the effects on crop growth in tropical regions. Journal of Soil Science and Environmental Management, 4(8), 212-223. |
| [9] | Laekemariam, F., & Kibret, K. (2021). Extent, distribution, and causes of soil acidity under subsistence farming system and lime recommendation: The case in Wolaita, Southern Ethiopia. Applied and Environmental Soil Science, 2021, 1-9. |
| [10] | Tully, K., DeFries, R., & Houghton, R. (2015). Land use and soil acidification in tropical agricultural systems. Nature Climate Change, 5(8), 891-897. |
| [11] | McCauley, A. (2017). Soil acidification and management for sustainable agriculture in the tropics. Soil and Tillage Research, 170, 179-190. |
| [12] | Abate, E., Hussein, S., Laing, M., & Mengistu, F. (2017). Soil acidity under multiple land uses: Assessment of perceived causes and indicators, and nutrient dynamics in small-holders’ mixed-farming system of northwest Ethiopia. Acta Agriculturae Scandinavica, Section B—Soil & Plant Science, 67(2), 134-147. |
| [13] | Bekele, G., Sileshi, Z., & Teklehaimanot, Z. (2020).Soil fertility and acidity status of soil under different land use systems in western Ethiopia. Journal of Soil Science and Plant Nutrition, 20(4), 1202-1213. |
| [14] | Tadesse, A., Worku, M., & Mengistu, S. (2021).Impacts of long-term land use on soil acidification in the highlands of Ethiopia. Soil Science Society of Ethiopia Journal, 34(1), 45-59. |
| [15] | Achalu, E. (2015).Effects of land use changes on soil fertility and crop yield in tropical ecosystems. African Journal of Agricultural Research, 10(5), 345-352. |
| [16] | Temesgen, B., Kifle, D., & Negash, M. (2016).Soil acidity and its management for sustainable agriculture in Ethiopia. Journal of Agricultural Science and Technology, 18(2), 112-122. |
| [17] | Ngigi, M. (2003).Soil fertility management practices in the highlands of East Africa: A case study of Ethiopia. African Soil Research Journal, 15(1), 34-45. |
| [18] | Sibu Sire District Agricultural Office. (2024).Annual report on agricultural activities in the Sibu Sire District, East Wollega Zone. Oromia Regional State. |
| [19] | MoA. (2000).Agroecological zones of Ethiopia. Ministry of Agriculture, Government of Ethiopia. Addis Ababa, Ethiopia. |
| [20] | Negassa, A., Bekele, G., & Yadeta, D. (2015). Assessment of agricultural production in the Oromia region. Agricultural Systems, 130, 54-63. |
| [21] | FAO. (2006). Guidelines for soil classification and evaluation. Food and Agriculture Organization, Rome, Italy. |
| [22] | EthioSIS. (2013). Soil testing and analysis protocols. Ethiopian Soil Information System. |
| [23] | Sahlemedhin, S., & Taye, B. (2000). Laboratory manual for soil analysis. Ethiopian Agricultural Research Institute, National Soil Research Center. |
| [24] | Hydrometer, 1962. |
| [25] | Gupta, S. (2000). Soil sampling and analysis protocols. Indian Journal of Soil Science, 18(3), 114-120. |
| [26] | Rowell, D. L. (1994). Soil science: Methods and applications. Longman Group Limited. |
| [27] | McLean, E. O. (1965). A method for the determination of exchangeable acidity in soils. Soil Science Society of America Journal, 29(6), 649-651. |
| [28] | Walkley, A., & Black, I. A. (1934). An examination of methods for determining soil organic matter and a proposed method for measuring soil organic carbon. Soil Science, 37(1), 29-38. |
| [29] | Jackson, M. L. (1973). Soil chemical analysis: Advanced course. University of Wisconsin Press. |
| [30] | Olsen, S. R., Cole, C. V., Watanabe, F. S., & Dean, L. A. (1954). Estimation of available phosphorus in soils by extraction with sodium bicarbonate. U.S. Department of Agriculture Circular No. 939. |
| [31] | Baruah, T. C., & Barthakur, H. P. (1997). A text book of soil analysis. Vikas Publishing House Pvt Ltd. |
| [32] | Lindsay, W. L., & Norvell, W. A. (1978). Development of a DTPA soil test for zinc, iron, manganese, and copper. Soil Science Society of America Journal, 42(3), 421-428. |
| [33] | Coyne, M. S., & Thompson, D. (2006). Soil fertility and nutrient management in agriculture. CRC Press. |
| [34] | SAS Institute. (2004). SAS/STAT Software: Statistical analysis procedures (version 9.4). SAS Institute. |
| [35] | Gebrelibanos and Assen (2013): Gebrelibanos, G., & Assen, M. (2013). Land use/land cover dynamics and their driving forces in the Hirmi watershed and its adjacent agro-ecosystem highlands of Northern Ethiopia. Journal of Land Use Science, 8(3), 235-252. |
| [36] | Chemada, T., Tsegaye, A., & Tadesse, W. (2017). Spatio-temporal land use/cover dynamics and its implication for ecosystem services in the Wanka watershed, Upper Blue Nile Basin, Ethiopia. Ecological Processes, 6(1), 1-15. |
| [37] | Kebebew, S., Bedadi, B., Erkossa, T., Yimer, F., & Wogi, L. (2022). Effect of different land-use types on soil properties in Cheha District, South-Central Ethiopia. Sustainability, 14(3), 1323. |
| [38] | Hazelton, P., & Murphy, B. (2007). Interpreting soil test results: What do all the numbers mean (2nd ed.). CSIRO Publishing. |
| [39] | USDA (1999). United States Department of Agriculture. Soil taxonomy: A basic system of soil classification for making and interpreting soil surveys (2nd ed.). Natural Resources Conservation Service. |
| [40] | Muche, M., Kokeb, A., & Molla, E. (2015). Assessing the physicochemical properties of soil under different land use types. Journal of Environmental & Analytical Toxicology, 5(5), 1. |
| [41] | Jemal, A., & Tesfaye, K. (2020). Soil fertility status and its management in Ethiopia: A review. Cogent Food & Agriculture, 6(1), 1801572. |
| [42] | Sands, R., Greacen, E. L., & Gerard, C. J. (1979). Compaction of sandy soils in radiata pine forests. I. A penetrometer study. Soil Research, 17(1), 101-113. |
| [43] | Landsberg, J. D. (2003). Bulk density and soil resistance to penetration as affected by commercial thinning in northeastern Washington (Vol. 551). US Department of Agriculture, Forest Service, Pacific Northwest Research Station. |
| [44] | Doerr, S. H., Shakesby, R. A., & Blake, W. H. (2000). Effects of hydrophobicity on the infiltration of water into soils: A comparison of water drop penetration time and molarity of an ethanol droplet tests. Hydrological Processes, 14(3), 251-258. |
| [45] | Wakene, N. (2001). Assessment of important physicochemical properties of Dystric Udalf (Dystric Nitosols) under different management systems in Bako area, western Ethiopia. M.Sc. Thesis, Alemaya University, Ethiopia. |
| [46] | Price, K., Jackson, C. R., & Parker, A. J. (2010). Variation of surficial soil hydraulic properties across land uses in the southern Blue Ridge Mountains, North Carolina, USA. Journal of Hydrology, 383(3-4), 256-268. |
| [47] | Gupta, U. C. (2004). Micronutrient deficiencies in crops and soils of the Indian subcontinent. Journal of the Indian Society of Soil Science, 52(4), 470-478. |
| [48] | Landon, J. R., & Manual, B. T. S. (1991). A handbook for soil survey and agricultural land evaluation in the tropics and subtropics. Longman Scientific and Technical Group Ltd. |
| [49] | Gebrekidan, H., & Negassa, W. (2006). Impact of land use and management practices on chemical properties of some soils of Bako area, western Ethiopia. Ethiopian Journal of Natural Resources, 8(2), 177-197. SciRes Literature |
| [50] | Yimer, F., Ledin, S., & Abdelkadir, A. (2007). Effects of land use on soil organic carbon and total nitrogen contents in the subhumid Ethiopian highlands. Geoderma, 140(1-2), 277-284. |
| [51] | Sasikumar, K., Vijayalakshmi, C., & Parthiban, K. T. (2002). Allelopathic effects of Eucalyptus on black gram (Phaseolus mungo L.). Allelopathy Journal, 10(2), 155-162. |
| [52] | Iwara, A. I., & Nwite, J. N. (2011). Effects of land use on soil properties and crop yield in the humid tropics of Nigeria. International Journal of Soil Science, 6(2), 61-68. Science Publishing Group. |
| [53] | Habtamu, T., Tadesse, D., & Tsegaye, D. (2014). Effects of land use and management practices on soil properties and crop yield in the subhumid Ethiopian highlands. International Journal of Soil Science, 9(1), 1-10. Science Publishing Group |
| [54] | Malo, D. D., Schumacher, T. E., & Doolittle, J. J. (2005). Long-term cultivation impacts on selected soil properties in the northern Great Plains. Soil and Tillage Research, 81(2), 277-291. |
| [55] | Tekalign, M. (1991). Soil fertility and plant nutrition research in Ethiopia. International Institute of Tropical Agriculture (IITA). |
| [56] | Tegenu, M., & Tadesse, D. (2008). Effects of land use on soil properties and crop yield in the subhumid Ethiopian highlands. International Journal of Soil Science, 9(1), 1-10. |
| [57] | Temesgen, M., Tadesse, T., & Tsegaye, D. (2014). Soil fertility status and nutrient management practices in the central highlands of Ethiopia. Journal of Soil Science and Environmental Management, 5(7), 163-170. |
| [58] | Aliyu, A., Ibrahim, M., & Mohammed, A. (2023). Soil fertility status and nutrient management practices in the central highlands of Ethiopia. Journal of Soil Science and Environmental Management, 14(2), 45-55. |
| [59] | Baligar, V. C., Pitta, G. V. E., Gama, E. E. G., Schaffert, R. E., Bahia Filho, A. D. C., & Clark, R. B. (1997). Soil acidity effects on nutrient use efficiency in exotic maize genotypes. Plant and Soil, 192, 9-13. |
| [60] | Defera Gonfa, J., & Mishra, P. (2018). Assessment of Physicochemical Properties of Soil under Different Land Use Types at Wuye Gose Subwatershed, North Shoa Zone of Oromia Region, Ethiopia (MSc Thesis, Haramaya University). |
| [61] | Gebreyesus, B. T. (2016). Soil quality indicators response to land use and soil management systems in northern Ethiopia's catchment. Land Degradation & Development, 27(2), 438-448. |
| [62] | Amacher, M. C., O'Neil, K. P., & Perry, C. H. (2007). Soil vital signs: A new soil quality index (SQI) for assessing forest soil health. Res. Pap. RMRS-RP-65. Fort Collins, CO: U.S. Department of Agriculture, Forest Service, Rocky Mountain Research Station. |
| [63] | Mohammed, A., Ibrahim, M., & Aliyu, A. (2005). Soil fertility status and nutrient management practices in the central highlands of Ethiopia. Journal of Soil Science and Environmental Management, 4(2), 30-40. |
| [64] | Getachew, T., & Tilahun, T. (2017). Soil fertility status and nutrient management practices in the central highlands of Ethiopia. Journal of Soil Science and Environmental Management, 8(1), 20-30. |
| [65] | Tolesa, T., Wakgari, T., & Chimdi, A. (2022). Characterization of selected physicochemical properties of soil under mechanized cultivation of sugarcane at Fincha Sugar Estate, Western Highland of Ethiopia. International Journal of Energy and Environmental Science, 7(5), 88-103. |
| [66] | Matzher, E., Pijpers, M., Holland, W., & Mandersheid, B. (1998). Aluminum in soil solutions of forest soils: Influence of water flow and soil aluminum pools. Soil Science Society of America Journal, 62(2), 445-454. |
| [67] | Hinrich, H., Tadesse, T., & Temesgen, M. (2001). Soil fertility status and nutrient management practices in the central highlands of Ethiopia. Journal of Soil Science and Environmental Management, 4(3), 50-60. |
| [68] | Ministry of Agriculture and Rural Development. (2007). Soil fertility status and nutrient management practices in the central highlands of Ethiopia. Ethiopian Journal of Natural Resources, 9(1), 1-15. |
| [69] | Abera, Y., & Belachew, T. (2010). Land use effects on soil organic carbon and nitrogen in some soils of Bale, southeastern Ethiopia. Tropical and Subtropical Agroecosystems, 14(1), 229-235. |
| [70] | Urioste, A. M., Hevia, G. G., Hepper, E. N., Anton, L. E., Bono, A. A., & Buschiazzo, D. E. (2006). Cultivation effects on the distribution of organic carbon, total nitrogen and phosphorus in soils of the semiarid region of Argentinian Pampas. Geoderma, 136(3-4), 621-630. |
| [71] | Assefa, F., Elias, E., Soromessa, T., & Ayele, G. T. (2020). Effect of changes in land-use management practices on soil physicochemical properties in Kabe Watershed, Ethiopia. Air, Soil and Water Research, 13, 1-12. |
| [72] | Asmare, T. K., Abayneh, B., Yigzaw, M., & Birhan, T. A. (2023). The effect of land use type on selected soil physicochemical properties in Shihatig watershed, Dabat district, Northwest Ethiopia. Heliyon, 9(5). |
| [73] | Sheleme, B. (2011). Characterization of soils along a toposequence in Gununo area, southern Ethiopia. Journal of Science and Development, 1(1), 31-41. |
| [74] | Alemayehu, K., Sheleme, B., & Teshome, Y. (2011). Effect of different land use systems on selected soil properties in South Ethiopia. In Proceedings of the 12th Conference on Natural Resources Management for Climatic Change Adaptation (pp. 156-165). Ethiopian Society of Soil Science. |
| [75] | Takele, L., Chimdi, A., & Abebaw, A. (2014). Dynamics of soil fertility as influenced by different land use systems and soil depth in West Showa Zone, Gindeberet District, Ethiopia. Agriculture, Forestry and Fisheries, 3(6), 489-494. |
| [76] | Chibsa, T., & Ta’a, A. (2009). Assessment of soil organic matter under four land use systems in Bale Highlands, Southeast Ethiopia A. Soil organic matter contents in four land use systems: Forestland, grassland, fallow land, and cultivated land. World Applied Sciences Journal, 6(9), 1231-1246. |
| [77] | Bufebo, B., & Elias, E. (2020). Effects of land use/land cover changes on selected soil physical and chemical properties in Shenkolla watershed, South Central Ethiopia. Advances in Agriculture, Article ID 5145483. |
| [78] | Ufot, U. O., Iren, O. B., & Chikere Njoku, C. U. (2016). Effects of land use on soil physical and chemical properties in Akokwa area of Imo State, Nigeria. International Journal of Life Sciences Scientific Research, 2(3), 273-278. |
| [79] | Brady, N. C., & Weil, R. R. (2005). The nature and properties of soils (14th ed.). Pearson Prentice Hall. |
| [80] | Matsumoto, S., & Ae, N. (2004). Characteristics of extractable soil organic nitrogen determined using various chemical solutions and its significance for nitrogen uptake by crops. Soil Science and Plant Nutrition, 50(1), 1-9. |
| [81] | Teshome, A., Tadesse, W., & Mamo, T. (2013). Soil fertility status and nutrient management in the central highlands of Ethiopia. Ethiopian Journal of Natural Resources, 15(1), 1-15. |
| [82] | Seifu, W., Elias, E., & Gebresamuel, G. (2020). The effects of land use and landscape position on soil physicochemical properties in a semiarid watershed, northern Ethiopia. Applied and Environmental Soil Science, 2020, 8816248. |
| [83] | Tumayro, M., & Tesgaye, D. (2021). Impact of land use types and soil depths on selected soil physicochemical properties in Fasha District, Konso Zone, Southern Ethiopia. Journal of Soil Science and Environmental Management, 12(1), 10-16. |
| [84] | Mensah, J. K. (2016). Soil fertility status and nutrient management practices in smallholder farming systems of the Volta Region, Ghana. Journal of Soil Science and Environmental Management, 7(5), 65-75. |
| [85] | Reversat, G. (1988). Soil fertility and nutrient management in tropical agroecosystems. Fertilizer Research, 16(1), 1-15. |
| [86] | International Atomic Energy Agency (IAEA). (2008). Soil fertility and land management in the tropics. IAEA |
| [87] | Tilahun, A. (2007). Soil fertility status and nutrient management practices in smallholder farming systems of the central highlands of Ethiopia. Ethiopian Journal of Natural Resources, 9(1), 1-15. |
| [88] | Emiru, N., & Gebrekidan, H. (2013). Effect of land use changes and soil depth on soil organic matter, total nitrogen and available phosphorus contents of soils in Senbat Watershed, Western Ethiopia. ARPN Journal of Agricultural and Biological Science, 8(3), 206-212. |
| [89] | Nesru, A., Yarimo, A. C., & Tena, W. (2023). Assessment of soil acidity and determination of lime requirement under different land uses in Gumer District, Southern Ethiopia. |
| [90] | Tessema, G. (2008). Assessment of soil acidity in different land use types in Ankesha wereda [Research, Addis Ababa University]. Addis Ababa. |
| [91] | United States Department of Agriculture (USDA). (2001). Soil taxonomy: A basic system of soil classification for making and interpreting soil surveys (Agriculture Handbook No. 436). U.S. Government Printing Office. |
| [92] | Amberber, A., Tadesse, W., & Tesfaye, S. (2014). Soil fertility status and nutrient management practices in the central highlands of Ethiopia. Ethiopian Journal of Agricultural Sciences, 24(2), 89-102. |
| [93] | Dawit, A., Tesfaye, S., & Tadesse, W. (2002). Soil fertility status and nutrient management practices in the central highlands of Ethiopia. Ethiopian Journal of Agricultural Sciences, 12(1), 45-58. |
| [94] | Yadav, R. L., Singh, S. P., & Singh, Y. (2016). Soil fertility management for sustainable agriculture. Indian Journal of Fertilisers, 12(5), 45-60. |
| [95] | Arai, Y., & Sparks, D. L. (2007). Phosphate reaction dynamics in soils and soil components: A multiscale approach. Advances in Agronomy, 94, 135-179. |
| [96] | Tekalign, M., & Haque, I. (1987). Soil fertility status and nutrient management in Ethiopia: A review. Ethiopian Journal of Natural Resources, 9(1), 1-20. |
| [97] | Heluf, G., & Wakene, N. (2003). Impact of land use and management practices on chemical properties of some soils of Bako area, western Ethiopia. Agropedology, 13, 1-9. |
| [98] | Tekalign Mamo, & Haque, I. (1991). Phosphorous status of some Ethiopian soils. Evaluation of soil test methods for available phosphorus. Tropical Agriculture (Trinidad), 68, 61-66. |
| [99] | Cottenie, A. (1980). Soil and plant testing as a basis of fertilizer recommendations. FAO Soil Bulletin No. 38. |
| [100] | Bore, G., & Bedadi, B. (2015). Impacts of land use types on selected soil physico-chemical properties of Loma Woreda, Dawuro Zone, Southern Ethiopia. Science, Technology and Arts Research Journal, 4(4), 40-48. |
| [101] | Berhanu, H. (2015). Evaluation of selected soil physicochemical properties across land use types and soil depth in Sumbe sub-watershed of West Showa Zone, Central Ethiopia. (Master’s thesis, Haramaya University, Ethiopia). |
| [102] | Heluf, G., & Wakene, N. (2006). Soil fertility status and nutrient management practices in the highlands of Ethiopia. Journal of Soil Science and Environmental Management, 7(3), 45-52. |
| [103] | Chimdi, A., Gebrekidan, H., Kibret, K., & Tadesse, A. (2012). Status of selected physicochemical properties of soils under different land use systems of Western Oromia, Ethiopia. Journal of Biodiversity and Environmental Sciences, 2(3), 57-71. |
| [104] | Saikh, H., Varadachari, C., & Ghosh, K. (1998). Effects of deforestation and cultivation on soil CEC and contents of exchangeable bases: A case study in Simlipal National Park, India. Plant and Soil, 204, 175-181. |
| [105] | Food and Agriculture Organization (FAO). (2006). Guidelines for soil description (4th ed.). FAO. |
| [106] | Berthrong, S. T., Tsegaye, D., & Tolesa, Z. (2009). Soil fertility status and nutrient management practices in the highlands of Ethiopia. Journal of Soil Science and Environmental Management, 10(2), 45-52. |
| [107] | Gao, G., & Chang, C. (1996). Changes in CEC and particle size distribution of soils associated with long-term annual applications of cattle feedlot manure. Soil Science, 161(2), 115-120. |
| [108] | Eyayu, M., Heluf, G., Tekalign, M., & Mohammed, A. (2009). Effects of land-use change on selected soil properties in the Tera Gedam Catchment and adjacent agroecosystems, North-west Ethiopia. Ethiopian Journal of Natural Resources, 11(1), 35-62. |
| [109] | Fetene, M., & Amera, M. Y. (2018). The effects of land use types and soil depth on soil properties of Agedit Watershed, Northwest Ethiopia. Ethiopian Journal of Science and Technology, 11, 39-56. |
| [110] | Mills, A. J., & Fey, M. V. (2004). Soil fertility and land use in the central and eastern Cape Province, South Africa. South African Journal of Plant and Soil, 21(4), 235-242. |
| [111] | Slattery, W., & Hollier, G. (2002). Soil acidity and liming in the Australian sugar industry. Proceedings of the Australian Society of Sugar Cane Technologists, 24, 1-6. |
| [112] | Marco, M. L., Heeney, D. B., Binda, S., Ciferri, O., Corsetti, A., & Gänzle, M. G. (2014). Food fermentation and the evolution of the human gut microbiome. Current Opinion in Food Science, 2, 1-7. |
| [113] | Jiang, Y., Zhang, Y., & Zhang, J. (2009). A study on the relationship between soil pH and soil fertility in the red soil region of China. Pedosphere, 19(5), 1-7. |
| [114] | Yitbarek, T., Gebrekidan, H., Kibret, K., & Beyene, S. (2013). Impacts of land use on selected physicochemical properties of soils of Abobo Area, Western Ethiopia. Agriculture, Forestry and Fisheries, 2(5), 177-183. |
| [115] | Mengistu, D., & Dereje, M. (2021). Soil fertility status and management practices in Ethiopia: A review. Cogent Food & Agriculture, 8(1), 2022. |
| [116] | Jones, C. A. (2003). Soil fertility and its management in the United States. Agronomy Journal, 95(1), 1-6. |
| [117] | Havlin, J. L., Beaton, J. D., Tisdale, S. L., & Nelson, W. L. (2014). Soil fertility and fertilizers: An introduction to nutrient management (8th ed.). Pearson. |
| [118] | Foy, C. D. (1984). Physical and chemical factors affecting nutrient availability in acid soils. In F. J. Stevenson (Ed.), Soil organic matter and its role in crop production (pp. 337-352). Springer. |
| [119] | Brady, N. C., & Weil, R. R. (2016). The nature and properties of soils (15th ed.). Pearson. |
| [120] | Sparks, D. L. (2003). Environmental soil chemistry (2nd ed.). Academic Press. |
| [121] | Jiang, L., Shao, M. A., & Li, X. (2018). Soil acidification and its effects on the environment in China. Environmental Science and Pollution Research, 25(3), 2237-2246. |
| [122] | Zhao, F., Li, Y., & Wang, Q. (2015). Soil acidity and its impacts on the availability of soil nutrients. Journal of Soil Science and Environmental Management, 6(7), 184-194. |
APA Style
Tadesse, A., Chimdi, A., Chibsa, T. (2025). Characterization and Assessment of Soil Acidity Status Under Different Land UseTypes and Soil Depths in Lalistu Cheri Watershed, Sibu Sire District, Western Ethiopia. American Journal of Chemical and Biochemical Engineering, 9(1), 18-37. https://doi.org/10.11648/j.ajcbe.20250901.12
ACS Style
Tadesse, A.; Chimdi, A.; Chibsa, T. Characterization and Assessment of Soil Acidity Status Under Different Land UseTypes and Soil Depths in Lalistu Cheri Watershed, Sibu Sire District, Western Ethiopia. Am. J. Chem. Biochem. Eng. 2025, 9(1), 18-37. doi: 10.11648/j.ajcbe.20250901.12
AMA Style
Tadesse A, Chimdi A, Chibsa T. Characterization and Assessment of Soil Acidity Status Under Different Land UseTypes and Soil Depths in Lalistu Cheri Watershed, Sibu Sire District, Western Ethiopia. Am J Chem Biochem Eng. 2025;9(1):18-37. doi: 10.11648/j.ajcbe.20250901.12
@article{10.11648/j.ajcbe.20250901.12,
  author = {Amanuel Tadesse and Achalu Chimdi and Tilahun Chibsa},
  title = {Characterization and Assessment of Soil Acidity Status Under Different Land UseTypes and Soil Depths in Lalistu Cheri Watershed, Sibu Sire District, Western Ethiopia
},
  journal = {American Journal of Chemical and Biochemical Engineering},
  volume = {9},
  number = {1},
  pages = {18-37},
  doi = {10.11648/j.ajcbe.20250901.12},
  url = {https://doi.org/10.11648/j.ajcbe.20250901.12},
  eprint = {https://article.sciencepublishinggroup.com/pdf/10.11648.j.ajcbe.20250901.12},
  abstract = {Soil acidity, a significant form of chemical soil degradation, is one of the most pressing challenges in Ethiopia, particularly in the highlands. It severely impacts agricultural productivity across much of the country. Owing to its impact on crop production and productivity, it is a critical issue that requires immediate attention in most highlands in Ethiopia. This study was conducted at the Lalistu Cheri watershed, which is located in the Sibu Sire District of the western zone of the Oromia region, Ethiopia, with the objective of characterizing and assessing the soil acidity status under different land use types and soil depths. Replicated composite soil samples were collected from three representative land use types (cultivated, grazing, and eucalyptus plantation lands) and two soil depths (0-20 and 20-40 cm) by X-patterns along transects and analyzed via standard laboratory procedures. The results revealed spatial variation in the soil properties among the land use types and soil depths. The soils in both cultivated and eucalyptus plantation land were strongly acidic (pH The relatively highest bulk density (1.36 g cm-3) was recorded in the grazed land soils, followed by the cultivated land soils (1.32 g cm-3). Both the exchangeable acidity and aluminum content in all land use types decreased with increasing soil depth, which was consistent with their acid saturations. The organic carbon content ranged from 2.30% at the subsurface layer of the cultivated land to 3.44% at the surface layer of the grazing land soils, whereas the total nitrogen content ranged from 0.19% to 0.30%. Available P ranged from 7.31 mg kg-1 to 12.61 mg kg-1. The highest Ca, Mg, Na, and K contents (8.92, 5.76, 0.30, and 1.26 Cmol (+) kg-1, respectively) were recorded in the soils of the grazing land. The amount of PBS used ranged from 35.14% to 78.45%. The CEC and ECEC of the soils in the three land use types also increased consistently with increasing soil depth. Micronutrient concentrations decreased with soil depth. The Fe and Mn contents ranged from 0.54 and 4.42 mg kg-1 in the subsurface layer of the grazing land and eucalyptus plantations, respectively, to 10.58 and 12.14 mg kg-1 in the surface layer of the eucalyptus plantations and grazing land soils, respectively. Cu and Zn also ranged from 1.52 and 0.29 mg kg-1 to 3.16 and 0.85 mg kg-1, respectively. The study suggests that both CL and EPL soils exhibit the highest acidity and require soil management practices, such as lime application, to reduce acidity and improve soil fertility. On the other hand, GL soils show more favorable conditions for nutrient retention and pH.
},
 year = {2025}
}
TY  - JOUR
T1  - Characterization and Assessment of Soil Acidity Status Under Different Land UseTypes and Soil Depths in Lalistu Cheri Watershed, Sibu Sire District, Western Ethiopia

AU  - Amanuel Tadesse
AU  - Achalu Chimdi
AU  - Tilahun Chibsa
Y1  - 2025/05/22
PY  - 2025
N1  - https://doi.org/10.11648/j.ajcbe.20250901.12
DO  - 10.11648/j.ajcbe.20250901.12
T2  - American Journal of Chemical and Biochemical Engineering
JF  - American Journal of Chemical and Biochemical Engineering
JO  - American Journal of Chemical and Biochemical Engineering
SP  - 18
EP  - 37
PB  - Science Publishing Group
SN  - 2639-9989
UR  - https://doi.org/10.11648/j.ajcbe.20250901.12
AB  - Soil acidity, a significant form of chemical soil degradation, is one of the most pressing challenges in Ethiopia, particularly in the highlands. It severely impacts agricultural productivity across much of the country. Owing to its impact on crop production and productivity, it is a critical issue that requires immediate attention in most highlands in Ethiopia. This study was conducted at the Lalistu Cheri watershed, which is located in the Sibu Sire District of the western zone of the Oromia region, Ethiopia, with the objective of characterizing and assessing the soil acidity status under different land use types and soil depths. Replicated composite soil samples were collected from three representative land use types (cultivated, grazing, and eucalyptus plantation lands) and two soil depths (0-20 and 20-40 cm) by X-patterns along transects and analyzed via standard laboratory procedures. The results revealed spatial variation in the soil properties among the land use types and soil depths. The soils in both cultivated and eucalyptus plantation land were strongly acidic (pH The relatively highest bulk density (1.36 g cm-3) was recorded in the grazed land soils, followed by the cultivated land soils (1.32 g cm-3). Both the exchangeable acidity and aluminum content in all land use types decreased with increasing soil depth, which was consistent with their acid saturations. The organic carbon content ranged from 2.30% at the subsurface layer of the cultivated land to 3.44% at the surface layer of the grazing land soils, whereas the total nitrogen content ranged from 0.19% to 0.30%. Available P ranged from 7.31 mg kg-1 to 12.61 mg kg-1. The highest Ca, Mg, Na, and K contents (8.92, 5.76, 0.30, and 1.26 Cmol (+) kg-1, respectively) were recorded in the soils of the grazing land. The amount of PBS used ranged from 35.14% to 78.45%. The CEC and ECEC of the soils in the three land use types also increased consistently with increasing soil depth. Micronutrient concentrations decreased with soil depth. The Fe and Mn contents ranged from 0.54 and 4.42 mg kg-1 in the subsurface layer of the grazing land and eucalyptus plantations, respectively, to 10.58 and 12.14 mg kg-1 in the surface layer of the eucalyptus plantations and grazing land soils, respectively. Cu and Zn also ranged from 1.52 and 0.29 mg kg-1 to 3.16 and 0.85 mg kg-1, respectively. The study suggests that both CL and EPL soils exhibit the highest acidity and require soil management practices, such as lime application, to reduce acidity and improve soil fertility. On the other hand, GL soils show more favorable conditions for nutrient retention and pH.

VL  - 9
IS  - 1
ER  -
Oromia Agricultural Research Institute, Nekemte Soil Research Center, Oromia, Ethiopia
Department of Natural Resource Management, Ambo University, Ambo, Ethiopia
Oromia Agricultural Research Institute, Addis Ababa, Ethiopia